Requests overview section displays requests in dashboard like fashion so you can get the big picture easier and faster.
All of the requests belong to single project selected in the first combo box 1 and they can be further filtered by organizational unit to which reporter of the request belongs to 2 and, finally, by request component 3.

All of the widgets are predefined. Some contain number of requests grouped by specific property such as status, assignee, reporter, importance etc, and some have a graphic display of data.
Widget has value, number and percentage of requests with said value inside it's group 4.
Maximize or minimize 5 the widget to see more or less data, so you can concentrate on what's important to you.
Clicking on any of the items in the widget will open a list of those requests for more detailed view and further manipulation.
Click on All in the first widget 4 opens up this list view:
Graph displays number of created or resolved requests per day in last 30 days for chosen project.

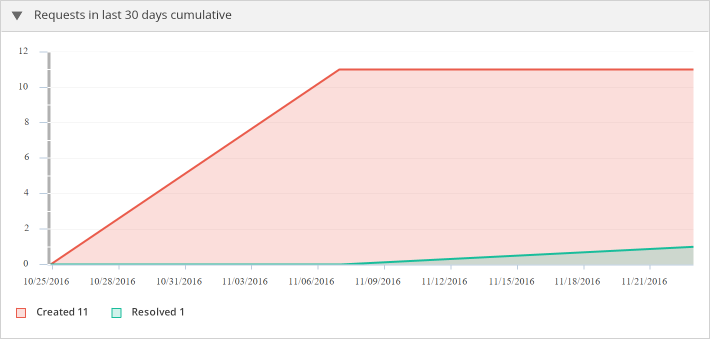
Graph displays cumulative number of created or resolved requests in last 30 days for chosen project.
Graph displays number of resolved requests per user in last 10 days for choosen project.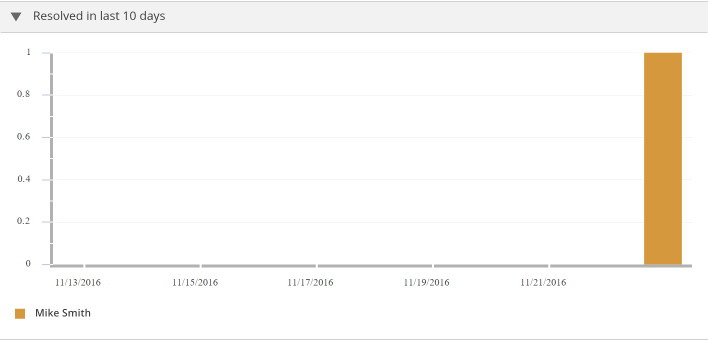
Like and share