In order to create a new report press the New Report button in requests section. A popup is displayed asking what data is the source of information for this report 1.
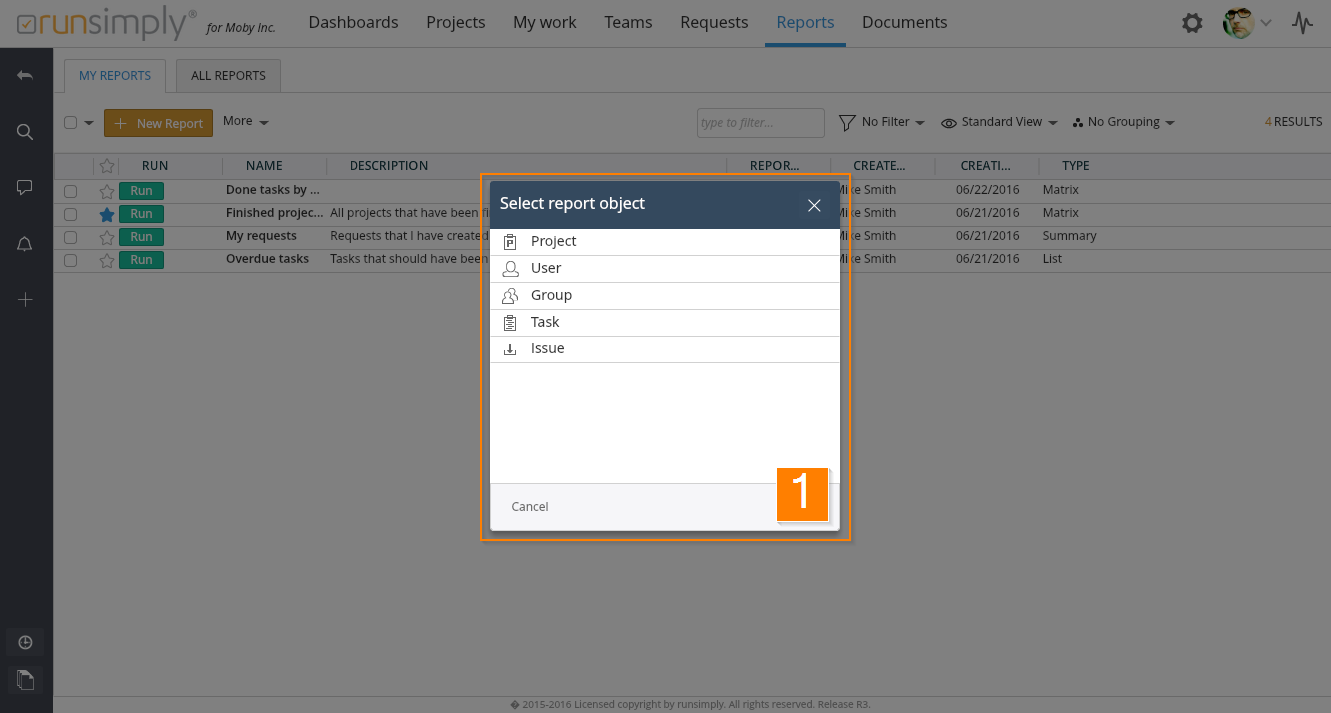
You can select any one of the offered data types after which a new page for report entry is displayed.
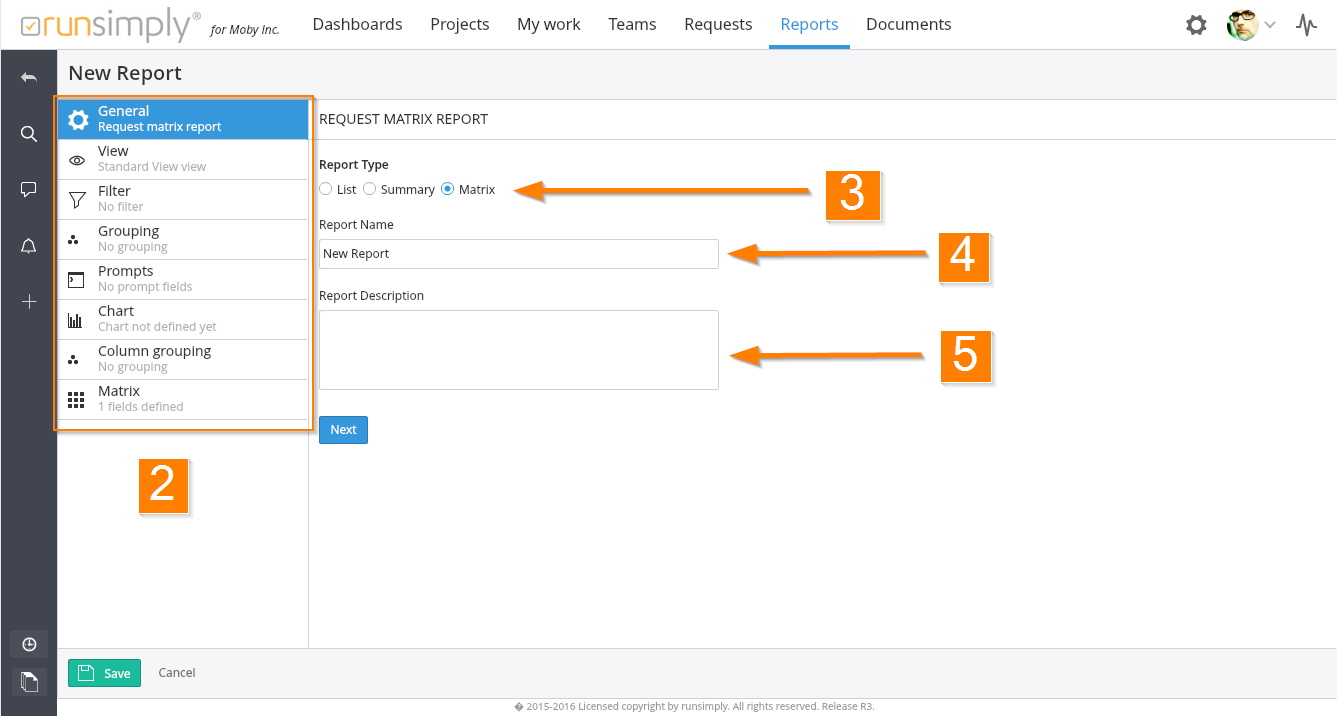
On the left of the screen 2 you can find main sections for setting up a new report. Which sections are shown depends on the type of report 3.
For list report, shown sections are General, View, Filter, Grouping and Prompts. For summary report Chart section is also available. For matrix report all sections are visible.
The easiest way to create a new report is by filling data through all sections in top down order. First you enter the basic report information in General section. Here you can select report type 3, enter report's name 4 and add a description 5 to better explain the purpose of this report.
After you are done with basic report information, you should complete all other categories.
Your report does not have to have filter or view defined. Filter and view are optional. List report doesn't have to have grouping defined either. Summary and matrix report require grouping to be defined and matrix report also requires column grouping to be defined.
Prompts don't have to be defined in any type of report. Prompts are optional.
Also if you are creating summary or matrix report, you have to enter required data in Chart section.
NOTE: All sections of report creation are explained in details in separate articles.
After you are done filling in the new report data, click the Save button and you are done. You will be able to use your new report, run it, share it and embed it in your dashboards.
Like and share