When creating reports the first thing you need to decide is what kind of data do you want your report to display: is it a list of tasks that are overdue, a list of projects that you manage which have problems and are perhaps late or maybe a pivot table showing the distribution of bugs that you resolved during all quarters of previous year.
Report can be both simple and complex depending on the type of information you need from your report. For that reason runsimply offers three types of reports:
- list report
- summary report
- matrix report
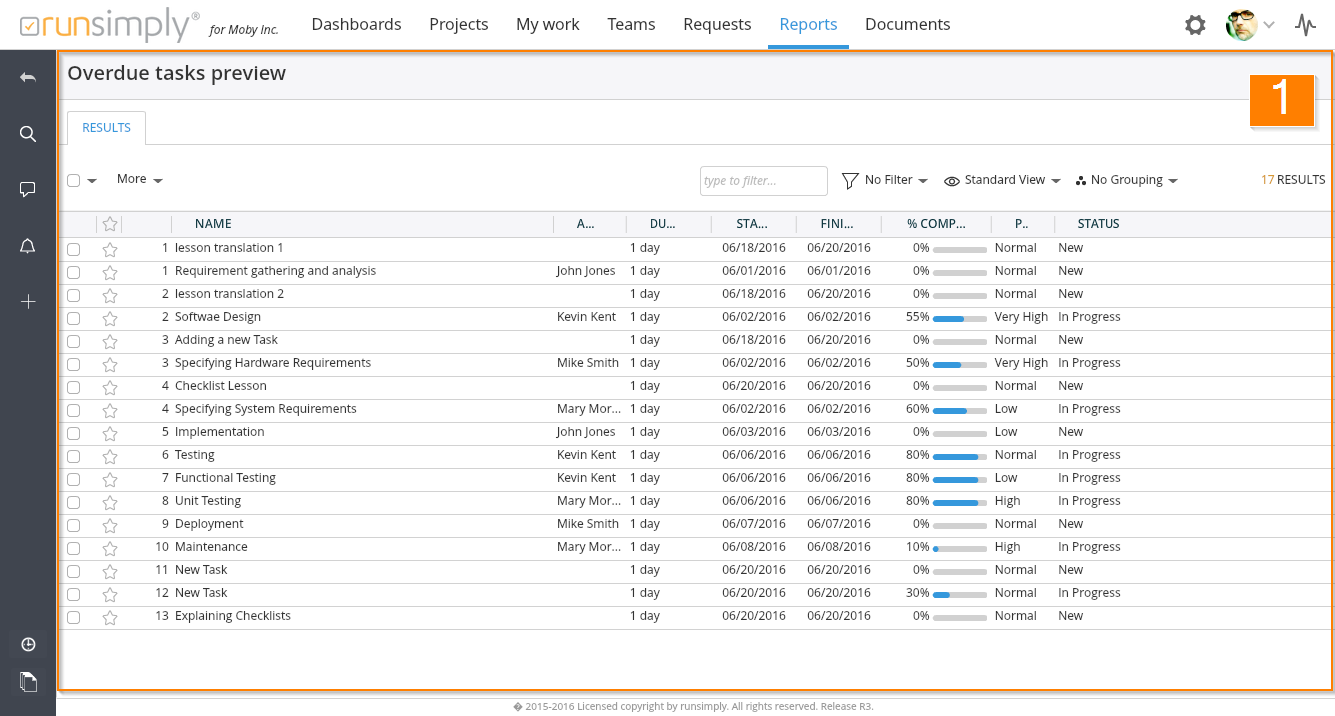
Creating list reports 1 is quite straightforward and quick. If you need to display a list of tasks that you should be working on this quarter grouped by upcoming months for example, a simple list report might be enough.
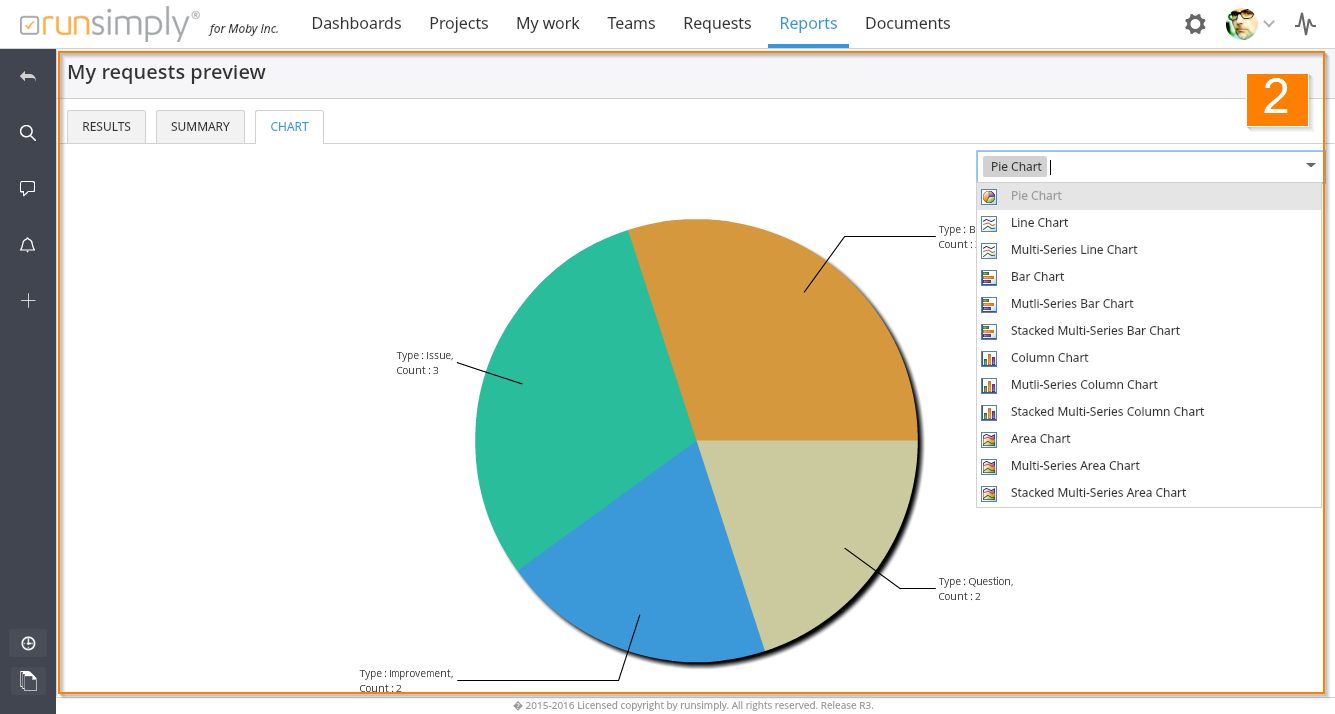
Summary reports 2 add more information to list reports. You can view the summary of the data your report is showing and you can also view that data by using one of many charts.
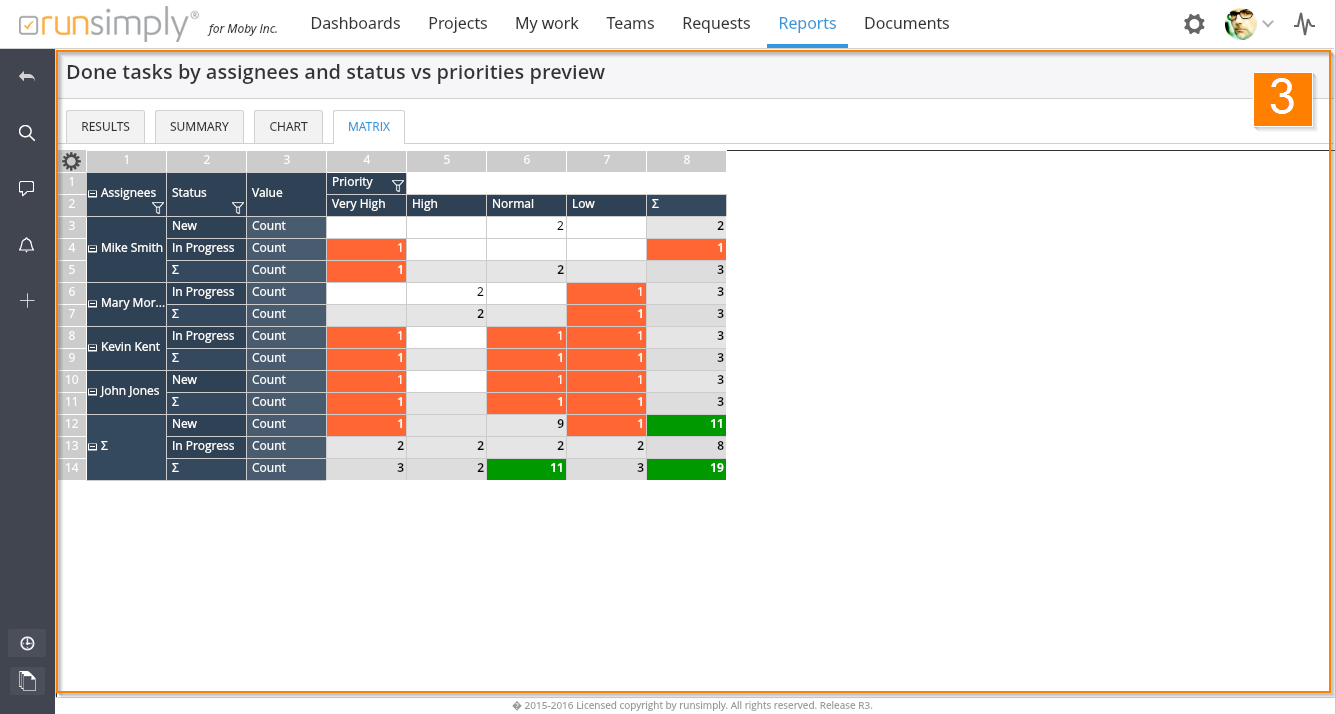
Matrix reports 3 are the most powerful report types. They show everything that summary report does and it adds a pivot table report to it. Using this type of report you can for example see which organizational units of the company, grouped by coutries, performed the best when it comes to reaching project milestones grouped by quarter of the year and then grouped by each month of the year. Creating this type of report requires a bit more time but once mastered it can be an extremely poweful tool to get the right information.
NOTE: After you create a report you can run it from the list of reports or you can embed it into a dashboard. If you want to allow other people to use your report you can share it.
Report elements
You can define many different aspects your report:
- what data it's gonna use (by using filters),
- how that data should look like on screen (by using views),
- should it be grouped (by using groupings),
- what chart it should use,
- how the pivot table should look like,
- should it use dynamic filters (by using report prompts)
Report filters
You can select data for your report using filter. You can use embedded runsimply filters, custom filters created by others or you can create a filter specifically for your report.
Filters allow for a very rich way of selecting data. For example you might just need tasks that are assigned to you. That would be a very simple filter. On the other hand, you might need to select tasks that are assigned to you that have a Very High or Urgent priority, that are in a Smooth condition and that are overdue or have their finish dates set for today and that last more than a week.
Report views
Using report views you can define what the data in your report will look like. You can define the exact fields i.e. columns that will be displayed. You can order them in any way you like and you can richly format that data.
For example, if your report is showing requests that you have reported, you might want to see when you reported them, to whom, current request status and due date of the request. You might also want to grey out those requests that have been closed and to emphasize those that are urgent by using red color (you would use conditional formatting for modifying colors and text).
Report groupings
You can group the data your report is showing. Also, you can use many levels of grouping, not just one. For example you would like to see the list of all resolved requests grouped by the quarter of the year they were resolved in and then grouped by their resolution status and then grouped by the person that resolved them.
Report prompts
Setting filters in your reports allows you to select very specific data that your report will show. For example you might define your report filter in such a way that your report will only include requests that are Bug or Feature request and that have been resolved or closed. But you might need this report run per project. You don't have to create a separate report for each of your projects, you can select project dynamicaly when you run your report. For this purpose you can create prompts for your report.
Report prompts are displayed on screen once report is being run by the user.
NOTE: Report prompts are filters that you define when running a report and not when creating it allowing higher level of flexibility and reusability of your reports.
Like and share