Reports enable you to get the information you need out of your projects, tasks, requests and other data in runsimply.
You can precisely define what data you want, how you want it to be displayed, you can view your data using several chart types and you can use pivot tables to view the summary of your data.
You can also embed all your reports into your dashboards so you can have the most important information all in one place.
Reports can also be shared among other users, you can use other people's reports but you can also create your private reports.
Viewing reports
To view reports and work with them, select Reports section on the main menu 1.
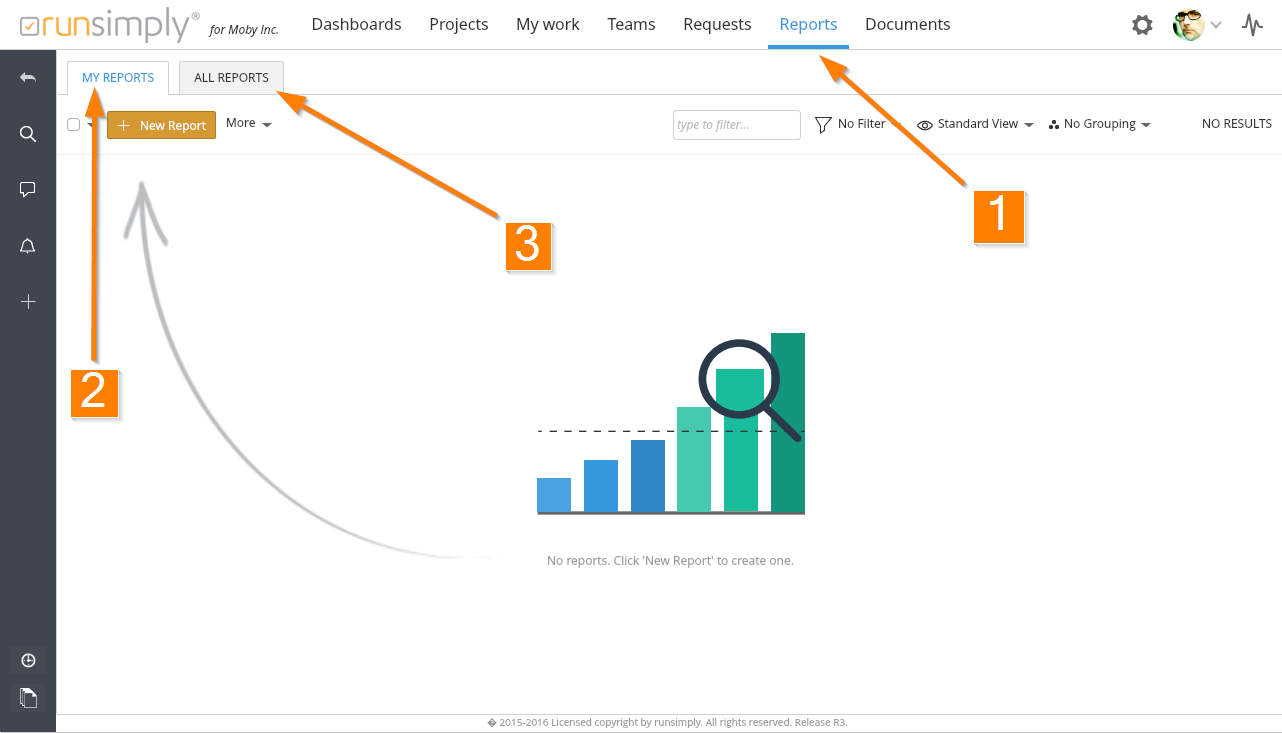
Initially you can see all your reports 2. You can see the list of all reports you have access to by clicking on the All Reports tab 3.
NOTE: Reports are displayed in standard runsimply list which means you can use filters, views and groupings to better organize you reports.
Working with reports
From the list of reports you can add new reports. Reports, like other data displayed in lists, can be exported to PDF and XLS format 4.
You can also star your favorite reports so you can find them more easily 6.
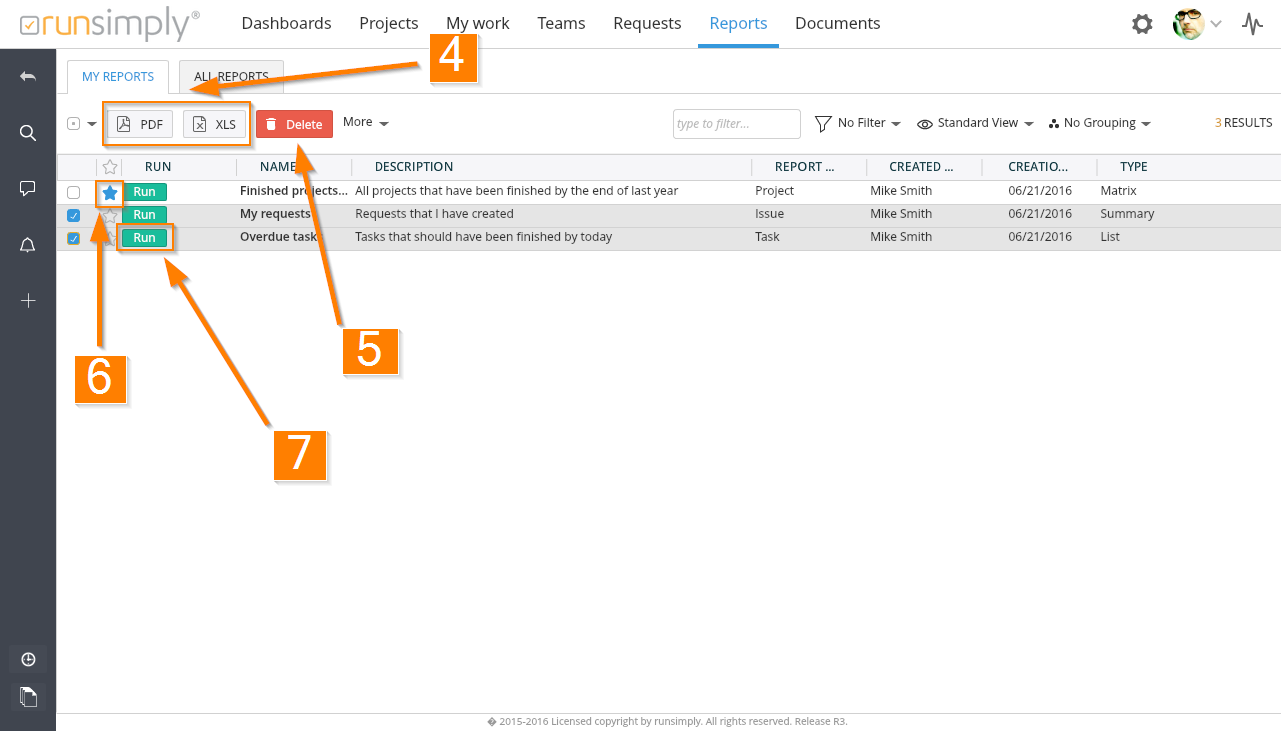
If you have permission to do so, you can modify reports and delete them if you no longer need them 5.
To run a report simply press the Run button displayed in reports list 7.
Like and share