If you have setup all other sections of your report before getting to matrix setup, you have actually already setup most things for your pivot table.
Pivot table's rows will be drawn using report's grouping and table's columns will be drawn using report's column grouping.
What is left to be setup are table's value fields and summaries.
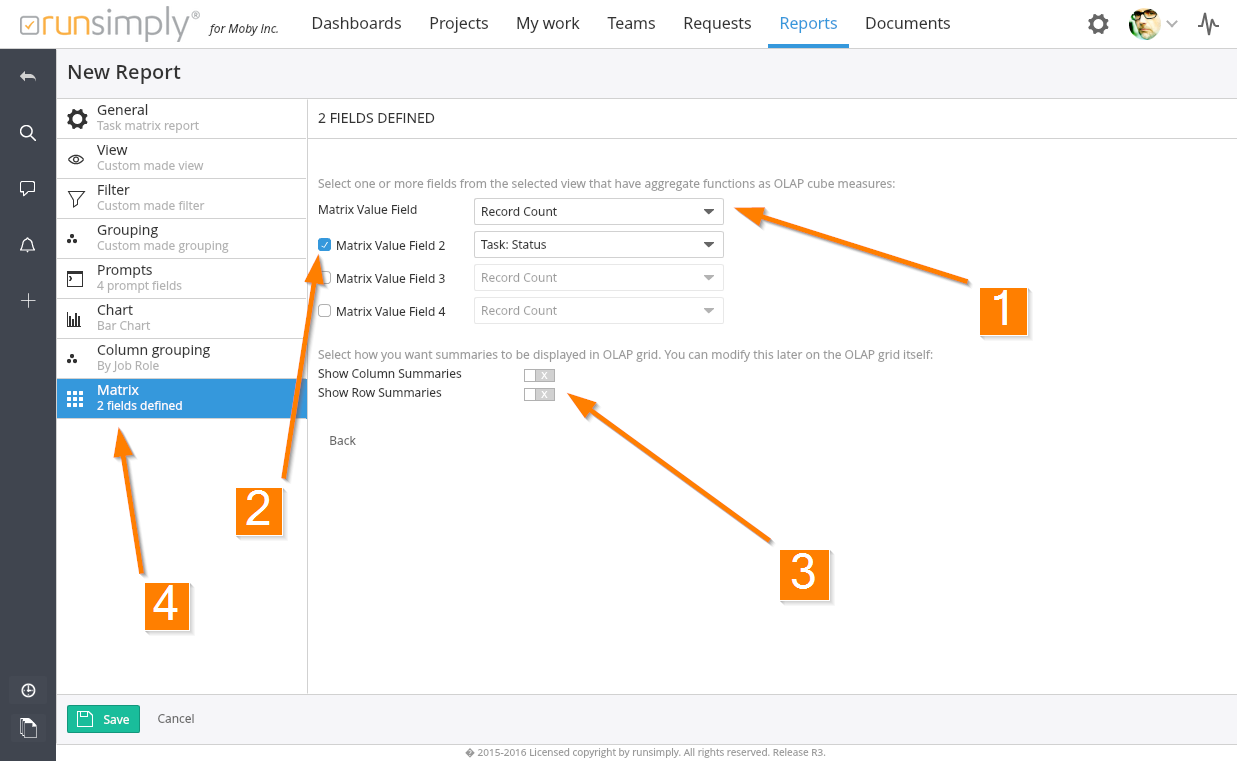
Matrix value field is what is going to be drawn in table cells. By default number of items is used as a matrix value field 1. You can set up to 4 fields. If you need more than one field, make sure to enable it by selecting it first 2.
Fields that you can select are the same as the fields you can select for report's chart: all fields from report's view that have aggregate function defined. You can always select record count regardless of the report's view.
You can also select if you want your pivot table to show summaries. By default they won't be shown.
NOTE: Regardless of whether you choose to show or hide summaries, you can change that in pivot table itself once you run your report.
For better overview of report that's being created, under Matrix section name you can see the number of added matrix fields 4.
Like and share